


AI-Driven Metabolic Imaging

Advancing Precision Medicine through Imaging, Lipidomics, and AI
Metabolic imaging allows us to study biochemical processes within cells and tissues in real-time, providing fundamental insights into metabolic, neurodegenerative, and oncological diseases. The integration of artificial intelligence (AI) with modern imaging techniques has revolutionized this field, enabling the extraction of complex data and improving the precision of analysis. This page presents the main research areas in our laboratory, focusing on innovations in AI-driven metabolic imaging.
Featured Research Areas:
Real-Time Functional Mapping of Lipid Metabolism
Real-Time Functional Mapping of Lipid Metabolism
Lipid metabolism is a highly dynamic and spatially regulated process that plays a central role in cellular energy balance, membrane architecture, and signaling. Traditional methods for studying lipid turnover often rely on destructive biochemical assays or endpoint imaging, providing only limited insight into how and where lipids are synthesized, stored, and utilized inside living cells.
Here we introduce real-time, high-resolution imaging approaches that enable the quantitative mapping of lipid dynamics based on the biophysical properties of lipid microenvironments—in particular, membrane micropolarity. Using spectral phasor analysis, solvatochromic probes such as Nile Red, and AI-driven segmentation, these methods can distinguish between different lipid classes (e.g., polar, non-polar, highly polar) and visualize the intracellular pathways of triglyceride and cholesteryl ester turnover with submicrometric resolution.
Together, these contributions define a new framework for studying lipid metabolism in situ and in real time, revealing metabolic imbalances that may underlie disease or stress responses.
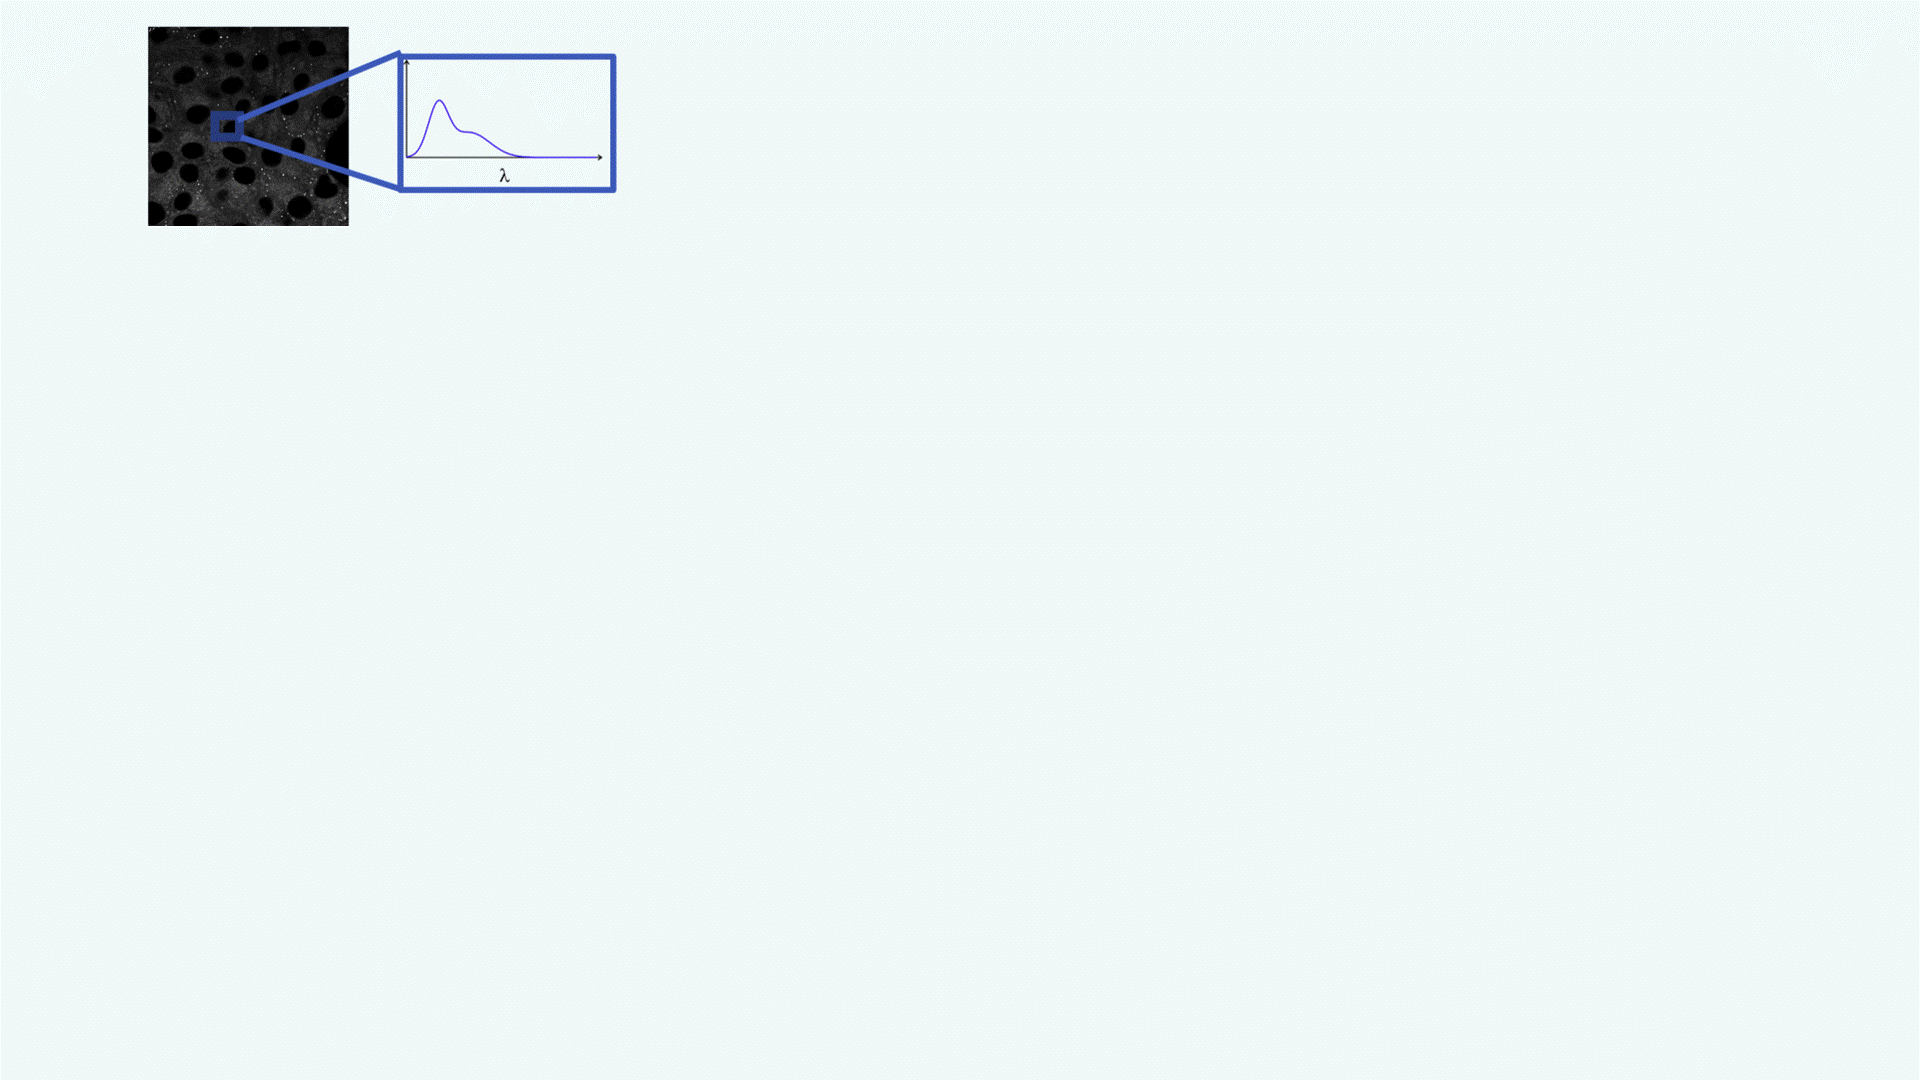
A confocal spectral image of a cell is acquired (grayscale image, top left). Each pixel contains spectral data: its emission spectrum (shown in the zoomed inset, λ on the x-axis).This rich spectral information forms the basis for downstream analysis.
The spectrum from each pixel is converted into a point in the phasor plot, producing a cloud of pixels in the (g, s) plane. This phasor plot acts as a spectral fingerprint: different lipid environments (non-polar, polar, highly polar) cluster in distinct regions. White contours define segments selected for further mapping (e.g., polar vs. non-polar regions).
Using the phasor regions defined in panel B, each pixel in the original image is reclassified according to its polarity:
Green = Polar lipids (e.g., phospholipids)
Red = Non-polar lipids (e.g., triglycerides in lipid droplets)
Blue = Highly polar lipids (e.g., free fatty acids, lysophospholipids)
The magnified image on the right highlights blue/HP-rich pixels surrounding lipid droplets (black circular areas), suggesting active lipid metabolism or remodeling (yellow arrows).
“This new method allows for a fine-tuned, real-time visualization of the turnover of fatty acids into triglycerides in live cells with submicrometric resolution. It also detects imbalances between lipid storage and usage, which may lead to metabolic disorders within living cells and organisms — without introducing sample preparation artifacts.”
AI & Multiparametric Imaging for
Cellular Phenotyping
Understanding how cells organize their internal architecture and modulate their metabolic activity requires tools capable of resolving not only structural, but also functional diversity at the subcellular level. Traditional imaging techniques often rely on predefined markers or assumptions, limiting their ability to capture the complexity and plasticity of cellular states.
In this context, unsupervised machine learning applied to multiparametric fluorescence imaging emerges as a powerful strategy to extract meaningful biological information without prior labeling or segmentation bias. By treating each pixel as a multidimensional data point—defined by spectral, temporal, and intensity parameters—this approach allows for the automatic discovery of spatially organized functional domains within the cell.
How does the algorithm work?
Each pixel in the image is represented as a multi-dimensional vector containing quantitative descriptors. These vectors are fed into an unsupervised learning pipeline to uncover hidden subcellular structures based purely on their biophysical features, without any labels or pre-training. The result is a functional segmentation of the cell, where regions sharing similar properties are grouped into clusters.
Applications
The following two studies apply this concept to distinct but complementary biological questions: one explores the physical remodeling of membrane phases, the other investigates the organization of metabolic activity within living cells. Although the computational method is shared, the biological targets, fluorescence sources, and insights differ significantly, highlighting the versatility of this AI-driven framework.
Membrane Phase Phenotyping
This study focuses on understanding how cell membranes are physically organized at the nanoscale. By analyzing how special fluorescent dyes behave when inserted into the membrane, we were able to map three key properties: hydration, lipid packing, and fluidity. These properties define the so-called “membrane phases.”
Using machine learning to analyze these parameters, the authors discovered that membranes are much more complex than previously thought. Instead of just two states (ordered vs. disordered), we identified up to six co-existing phases, each with its own biophysical signature. This approach also makes it possible to detect subtle membrane changes in real time—for example, how neurons respond to excess glucose, a condition that mimics diabetic stress.
Metabolic Phenotyping
This study explores how different regions within a living cell manage energy. The method is based on the natural fluorescence of metabolic cofactors like NADH and FAD, molecules that reflect how actively a cell is producing energy through respiration or glycolysis.
By analyzing the lifetime and intensity of these signals with fluorescence imaging, and then applying unsupervised clustering algorithms, we could group pixels into distinct “metabolic clusters.” Each cluster reflects a different energy state—some more oxidative, others more glycolytic. This approach allows to create detailed metabolic maps of single cells and observe how they rewire their energy pathways in response to drugs or genetic changes, such as overactivation of mitochondrial enzymes.
